


By Jordan Clayton, USDA 

The UWAU is a monthly report issued by the NRCS-Utah Snow Survey office for each month outside the snowpack season.  The UWAU includes summaries of Utah’s statewide and basin-level precipitation, soil moisture, reservoir, and current streamflow conditions. Reservoir and streamflow data per basin are then compared with historical observations to generate Water Availability Indexes for each region.

The report is organized to reflect two distinct geographic areas being monitored: the low elevation valley sites (Soil Climate Analysis Network, aka SCAN) that are critical for agricultural production and operations; and the high elevation mountainous areas where water supply is generated (SNOw TELemetry, aka SNOTEL).

General summary:

Valley Conditions (SCAN) as of July 1:

Statewide precipitation in valley locations was a disappointing 51% of normal for the month of June, causing Utah’s water-year-to-date precipitation to drop to 96% of normal as measured at our SCAN sites.  Soil moisture in Utah’s valleys averaged around 35% of saturation as of July 1st, though that hardly tells the whole story.  The Uinta Basin, for example, has record dry valley soil moisture conditions, and the St. George region is also hovering very close to its record minimum.

Mountain Conditions (SNOTEL) as of July 1:

June did not bring the precipitation that Utah’s mountains needed.  Our record-poor snowpack story has been well-documented in our previous reports, but now our precipitation deficits need to be addressed.  The map in the attached report shows the precipitation measured at Utah’s SNOTEL sites, expressed as a percentile to highlight unusual conditions.  Note that any red dot on that map is a site where the precipitation is in the bottom 15% of all observations.  This map shows only the November 1 through July 1 precipitation totals and intentionally excludes the rain Utah received in October in order to illustrate how unusually dry our state has been since the storms we received at the beginning of our water year.

Year-to-date cumulative precipitation at Utah SNOTEL sites is at 86% of normal after only receiving 40% of normal precipitation during June. Soil moisture in Utah’s mountains mirrors the early snowmelt and poor precipitation totals, i.e. the ground is extremely dry and, in some cases, setting records for low moisture content (such as for the Upper Sevier basin and in Southwestern Utah).

Beyond the water availability concerns (next section), the ongoing dry conditions in Utah have produced elevated fire risk.  One of our SNOTEL sites (Merchant Valley) was destroyed in the Cottonwood Fire above the town of Beaver, and several others continue to be threatened.  Most importantly, our hearts are with those more immediately impacted by the fires in Utah this year.  We remain hopeful that our summer monsoon will kick in and diminish the fire risk.

Water Availability as of June 1:

Extremely poor water availability is impacting multiple areas of the state.  The Upper and Lower Sevier, San Pitch, Beaver, Joes Valley, and Blacks Fork watersheds and the Eastern Uinta region are all at or below the 5th percentile for available water (current streamflow + current reservoir storage- see Water Availability Index (WAI) table).  In fact, all but three of Utah’s 19 major basins are in the bottom 20th percentile for their WAI. 

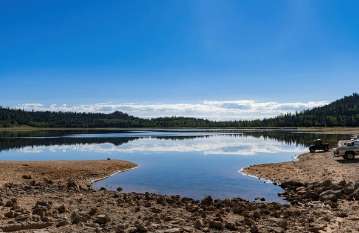
Utah’s statewide reservoir storage is at 60% of capacity, down 18% from this time last year.  In some areas, the lack of storage is extreme, such as for the San Pitch (4% of capacity) and Upper Sevier (8% of capacity, down 40% from this time last year).  On the other hand, Southwestern Utah’s reservoir storage is at 69% of capacity which makes it the only area of the state to have not depleted its storage relative to this time last year.

" data-pos="top" value="0" max="100">

July 1st Utah Water Availability Update3 min read

By Jordan Clayton, USDA 

The UWAU is a monthly report issued by the NRCS-Utah Snow Survey office for each month outside the snowpack season.  The UWAU includes summaries of Utah’s statewide and basin-level precipitation, soil moisture, reservoir, and current streamflow conditions. Reservoir and streamflow data per basin are then compared with historical observations to generate Water Availability Indexes for each region.

The report is organized to reflect two distinct geographic areas being monitored: the low elevation valley sites (Soil Climate Analysis Network, aka SCAN) that are critical for agricultural production and operations; and the high elevation mountainous areas where water supply is generated (SNOw TELemetry, aka SNOTEL).

General summary:

Valley Conditions (SCAN) as of July 1:

Statewide precipitation in valley locations was a disappointing 51% of normal for the month of June, causing Utah’s water-year-to-date precipitation to drop to 96% of normal as measured at our SCAN sites.  Soil moisture in Utah’s valleys averaged around 35% of saturation as of July 1st, though that hardly tells the whole story.  The Uinta Basin, for example, has record dry valley soil moisture conditions, and the St. George region is also hovering very close to its record minimum.

Mountain Conditions (SNOTEL) as of July 1:

June did not bring the precipitation that Utah’s mountains needed.  Our record-poor snowpack story has been well-documented in our previous reports, but now our precipitation deficits need to be addressed.  The map in the attached report shows the precipitation measured at Utah’s SNOTEL sites, expressed as a percentile to highlight unusual conditions.  Note that any red dot on that map is a site where the precipitation is in the bottom 15% of all observations.  This map shows only the November 1 through July 1 precipitation totals and intentionally excludes the rain Utah received in October in order to illustrate how unusually dry our state has been since the storms we received at the beginning of our water year.

Year-to-date cumulative precipitation at Utah SNOTEL sites is at 86% of normal after only receiving 40% of normal precipitation during June. Soil moisture in Utah’s mountains mirrors the early snowmelt and poor precipitation totals, i.e. the ground is extremely dry and, in some cases, setting records for low moisture content (such as for the Upper Sevier basin and in Southwestern Utah).

Beyond the water availability concerns (next section), the ongoing dry conditions in Utah have produced elevated fire risk.  One of our SNOTEL sites (Merchant Valley) was destroyed in the Cottonwood Fire above the town of Beaver, and several others continue to be threatened.  Most importantly, our hearts are with those more immediately impacted by the fires in Utah this year.  We remain hopeful that our summer monsoon will kick in and diminish the fire risk.

Water Availability as of June 1:

Extremely poor water availability is impacting multiple areas of the state.  The Upper and Lower Sevier, San Pitch, Beaver, Joes Valley, and Blacks Fork watersheds and the Eastern Uinta region are all at or below the 5th percentile for available water (current streamflow + current reservoir storage- see Water Availability Index (WAI) table).  In fact, all but three of Utah’s 19 major basins are in the bottom 20th percentile for their WAI. 

Utah’s statewide reservoir storage is at 60% of capacity, down 18% from this time last year.  In some areas, the lack of storage is extreme, such as for the San Pitch (4% of capacity) and Upper Sevier (8% of capacity, down 40% from this time last year).  On the other hand, Southwestern Utah’s reservoir storage is at 69% of capacity which makes it the only area of the state to have not depleted its storage relative to this time last year.

Share

Leave the first comment